
In education classes, I heard a lot about the benefits of using anchor charts with elementary students. But every time I tried to create an anchor chart, they always looked horrific!
I can’t draw. I don’t know how to write in cutesy fonts (or even with just decently neat handwriting). I can never write in a straight line. How were my students supposed to access the knowledge on the anchor chart if they could barely read it?!
It was my frustration with handwritten anchor charts that led me to create digital anchor charts. And I have never looked back. Here is why you should use digital anchor charts and how to use them in your elementary classroom.
#1: Digital anchor charts are quick and easy.
The best part about digital anchor charts is that they are super simple to make. You don’t need a fancy program to create them – simply using PowerPoint or Canva will do the trick. By creating an anchor chart digitally, you have access to tons of fonts and images to make your chart visually appealing, neat, and easy to read.
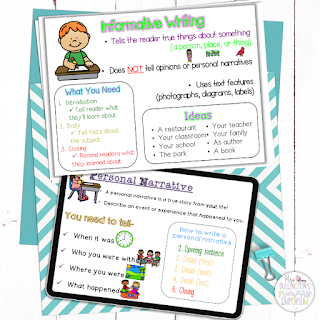
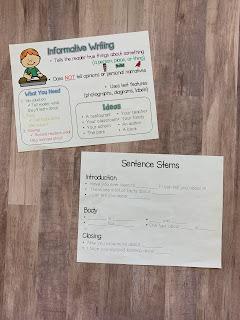
For example, with these writing anchor charts, I was able to place a ton of information on the chart without it being overwhelming. I utilized clipart, different fonts and colors, and boxes to separate information. These writing anchor charts cover topics such as personal narratives and informational writing. You can check out these writing digital anchor charts here.
#2: They can be used in a multitude of ways.
My favorite thing about digital anchor charts is how they can be used. Most obvious is actually turning it into a poster and displaying it in your classroom. (P.S. Did you know you can print poster size even with a regular printer – a quick Google search will show you how!).
You can also use this anchor chart to directly teach a concept to students. I print the anchor chart, laminate it, and display it on my document camera. You could also display the chart digitally on a screen or projector. Additionally, print the chart on a half sheet of paper, and have students glue it into their journals.
After the lesson or unit is completed, I staple the anchor chart to the subject area on a bulletin board. Some anchor charts cover topics that will be used year round, such as speaking and listening, connections, author’s purpose. For these charts, I recommend printing poster-size and hanging them where it is visible to all.
#3: You can still “create” the chart with students.
Lots of teachers like to create the anchor chart with students in class. You don’t have to ditch this method with digital anchor charts. If you want to have this interactive component of creating an anchor chart, during your lesson, take notes with students on the board or easel. Think of this as a rough draft!
Then, turn this rough draft into a lovely anchor chart with your digital platform after class is over. This will then be the final version that is hung on the wall and used for reviewing the concept later.
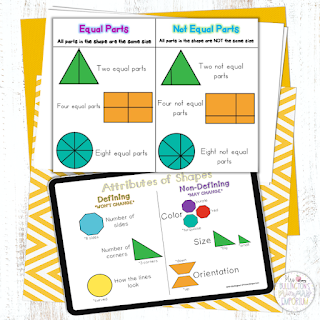
Take these elementary math anchor charts for example! I created the rough draft with my students (and let me tell you, my hand drawn shapes are kinda rough). Then, I went back and created a digital version. I have digital anchor charts for both equal parts and shape attributes.
Digital anchor charts can save you lots of time and stress! Not to mention, you can reuse them again and again! Your elementary students will thank you for having clear anchor charts they can use over and over again 🙂
Want a free digital anchor chart to get started with? Grab my free accountable talking anchor charts! These charts will help your students agree and disagree respectfully during cooperative learning.
